🔎 Project Overview
 Introduction
Netflix is one of the world’s largest streaming platforms, offering a vast collection of movies and TV shows from different genres, countries, and time periods. This project aims to analyze Netflix’s content catalog to uncover key insights into content distribution, genre trends, country contributions, and viewing patterns.
 Dataset Description
This analysis is based on the publicly available Netflix Movies and TV Shows dataset from Kaggle. It contains 8,807 records with 12 attributes that provide information on titles, directors, cast, countries, release years, ratings, and more.
 Objectives of the Analysis
The primary goals of this project are:
- Content Analysis: Understand the distribution of Movies vs. TV Shows.
- Country-Based Insights: Identify which countries produce the most Netflix content.
- Genre Popularity: Determine the most frequent genres on the platform.
- Trends Over Time: Analyze how Netflix’s content library has grown over the years.
- Ratings & Maturity Levels: Explore the distribution of content ratings (TV-MA, PG, R, etc.).
- Duration Analysis: Examine movie durations and TV show season counts.
 Methodology
- Data Cleaning: Handling missing values, transforming data types, and restructuring key columns.
- Exploratory Data Analysis (EDA): Uncovering trends through data visualization and statistical summaries.
- Power BI Visualization: Creating interactive dashboards to present findings effectively.
 Expected Outcomes
By the end of this analysis, I will have a clear understanding of Netflix’s content strategy, helping answer critical business and user behavior questions. The final Power BI dashboard will allow for dynamic exploration of Netflix’s catalog.
🧹 Data Cleaning
Load & Inspect Data
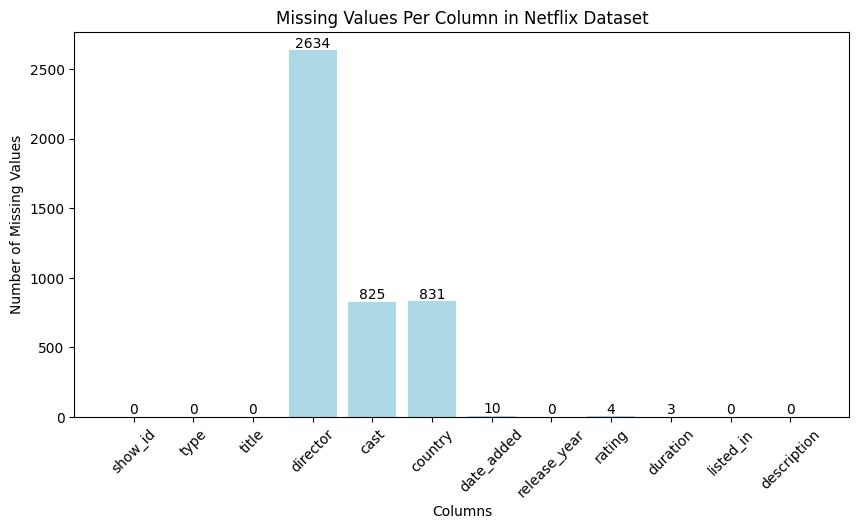
Handling Missing Values
 Director
- Merged df_credits and df_titles on the
'id'column. - Extracted only the records where
'role' == "DIRECTOR"and created a new dataset df_directors. - Renamed
'name'column in df_directors to'director'. - Merged df_directors with the Netflix dataset based on the
'title'column. - Filled missing director values using the enriched dataset.
- Any remaining missing values were filled with
"Unknown Director".
Cast
- Filled missing values with “Unknown”
Country
- Used cast information to infer missing country values
- Remaining missing values filled with “Unknown”
Date Added
- Filled missing values with the most frequent date in the dataset
Rating
- Filled missing values with the most frequent rating
Duration
- Extracted minutes for movies into
duration_in_minutes(integer) - Extracted seasons for TV shows into
num_seasons(integer) - Non-numeric values set to
0
Data Type Validation and Conversion
📈 Exploratory Data Analysis (EDA)
Exploratory Data Analysis (EDA)
Distribution of Movies vs. TV Shows
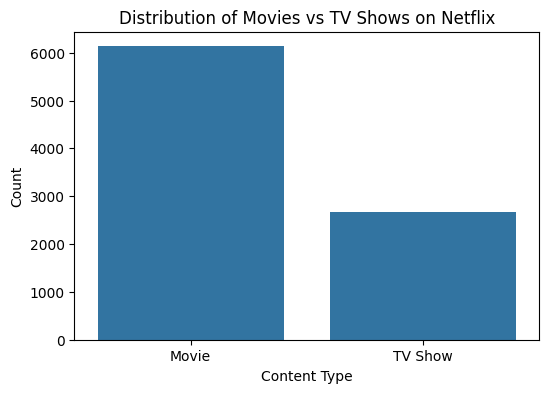
The chart indicates that there are significantly more movies than TV shows in the dataset.
Analyzing new content additions over the years
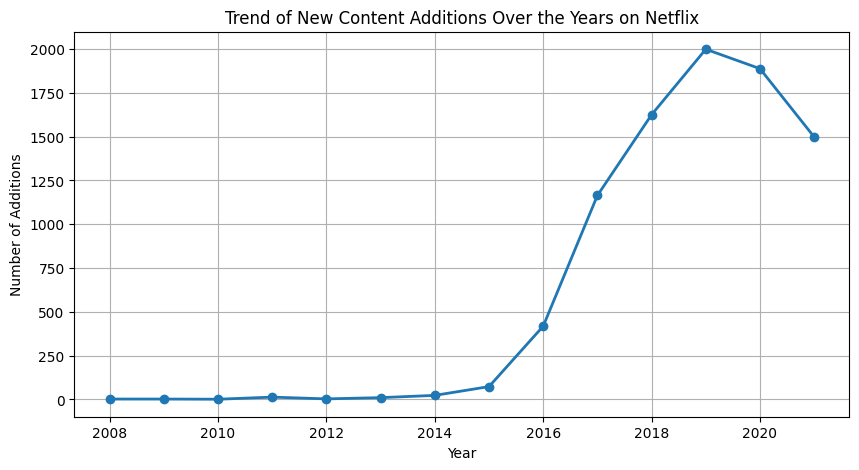
The chart indicates that there was a significant rise in additions from around 2015, peaking in 2019 before slightly declining.
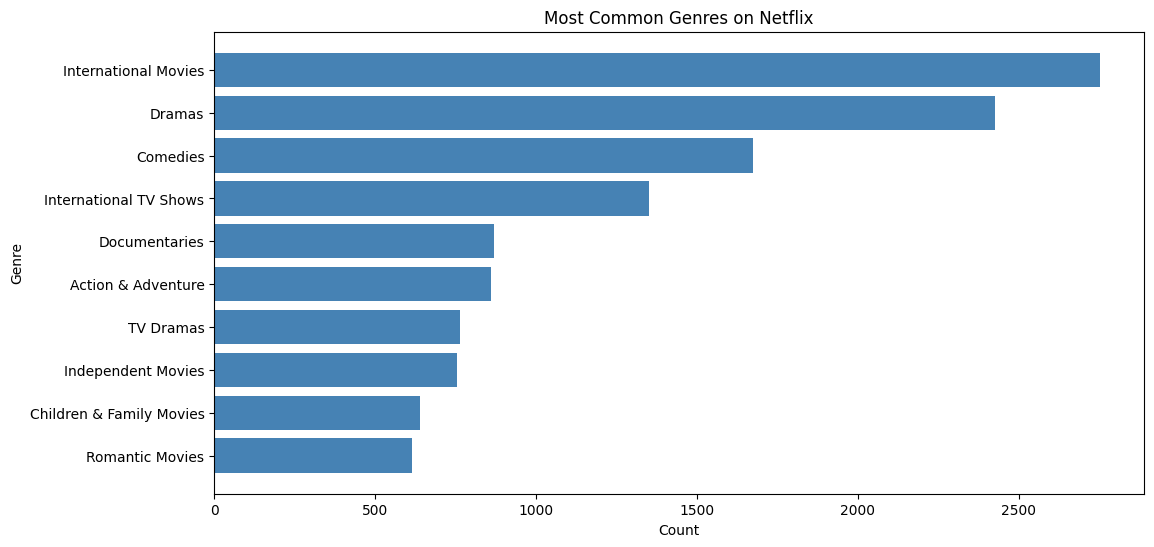
Finding the most common genres on Netflix
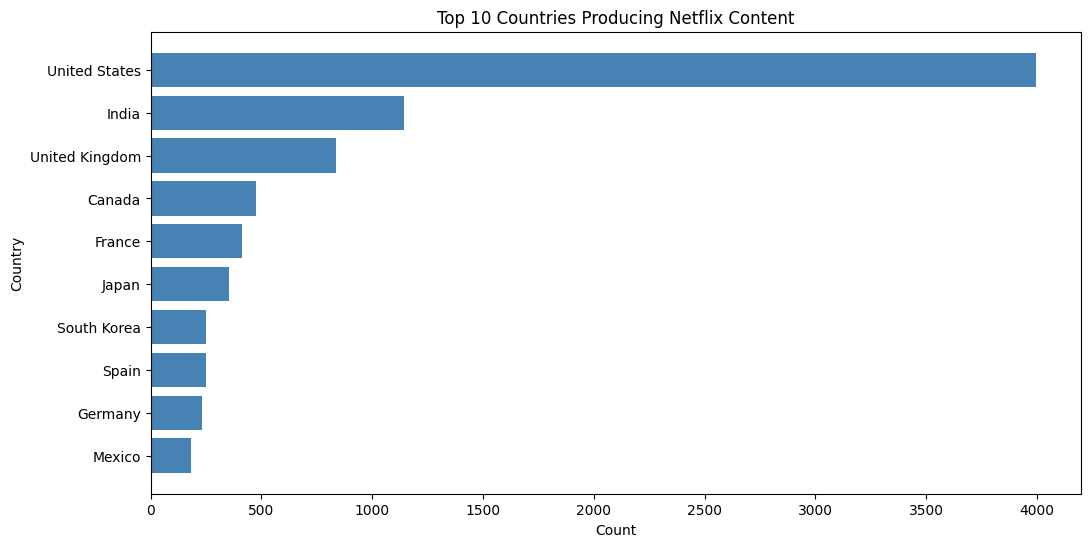
Count the number of titles produced by each country
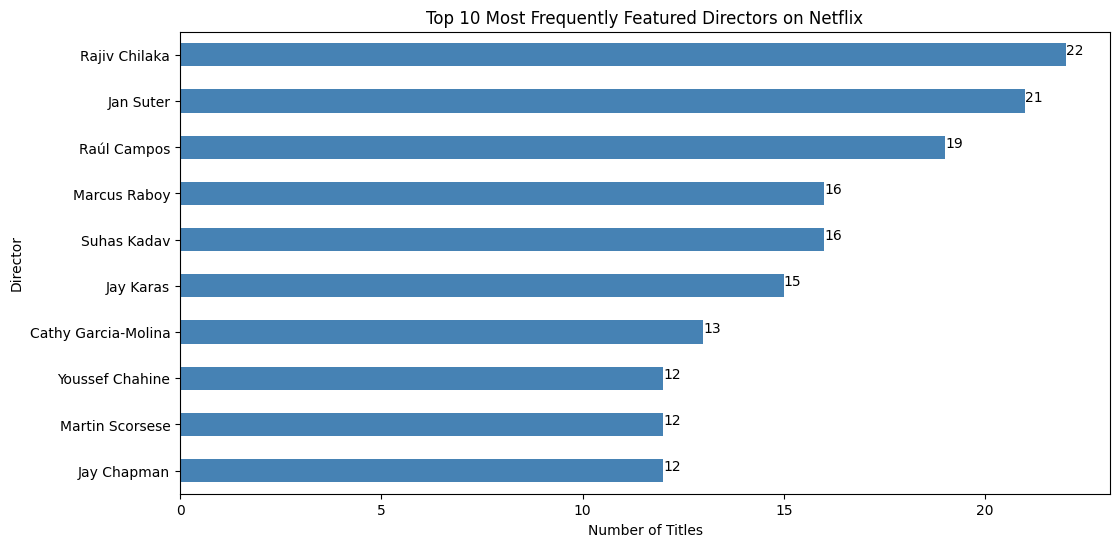
Count the most frequently featured directors
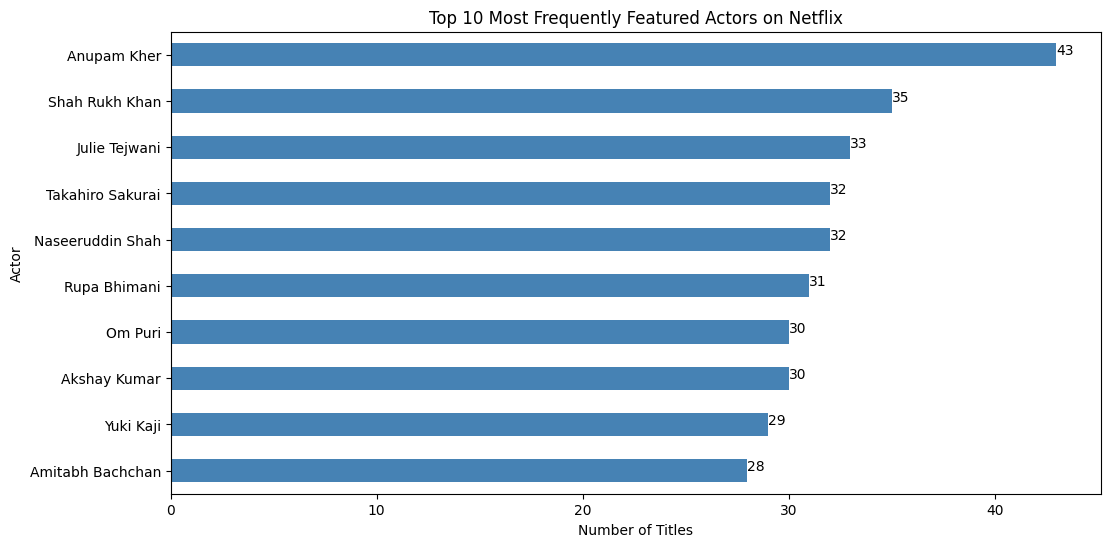
Count the most frequently appearing actors
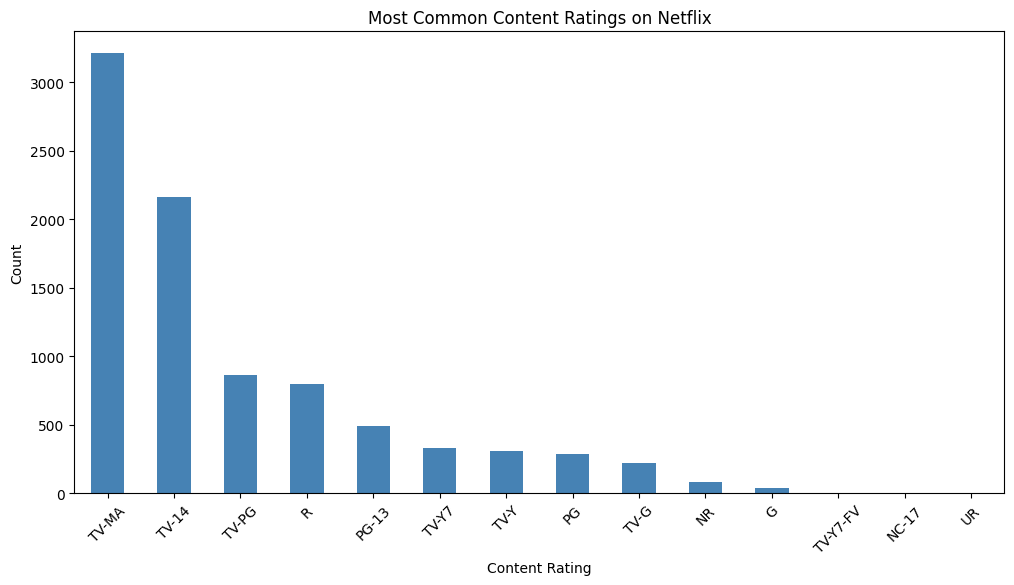
Most common content ratings on Netflix
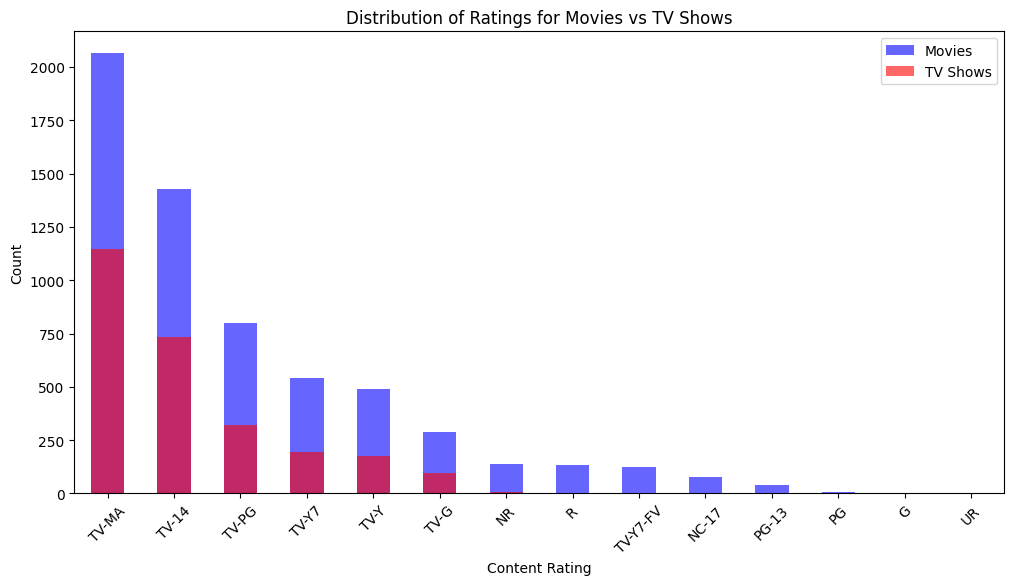
Compare Rating Distribution Between Movies & TV Shows
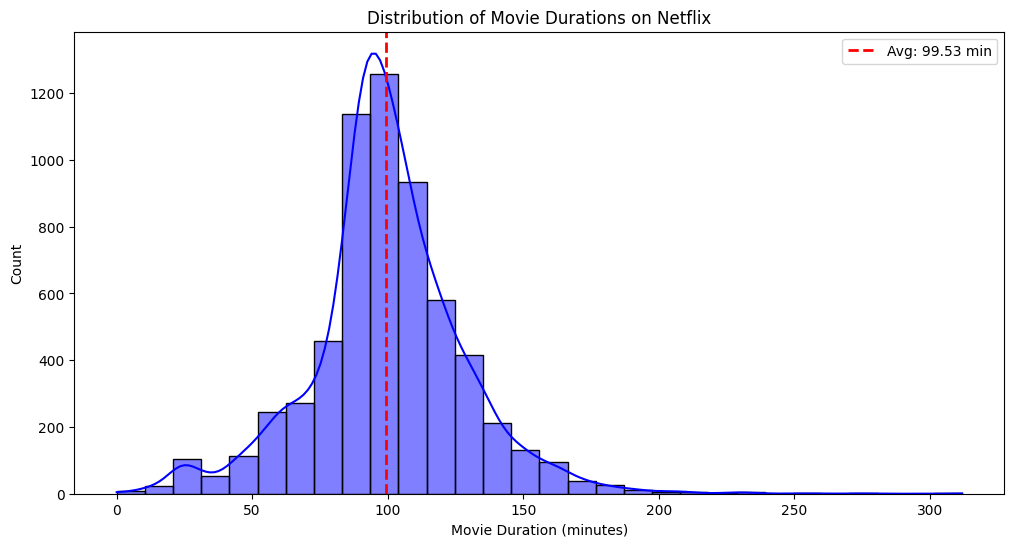
Average duration of movies on Netflix.
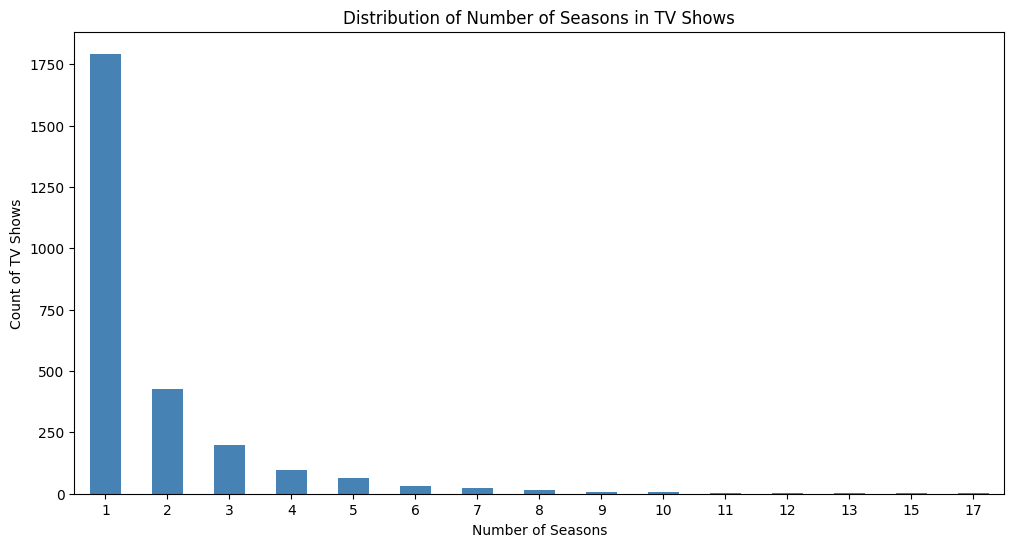
Variation in the number of seasons across TV shows.
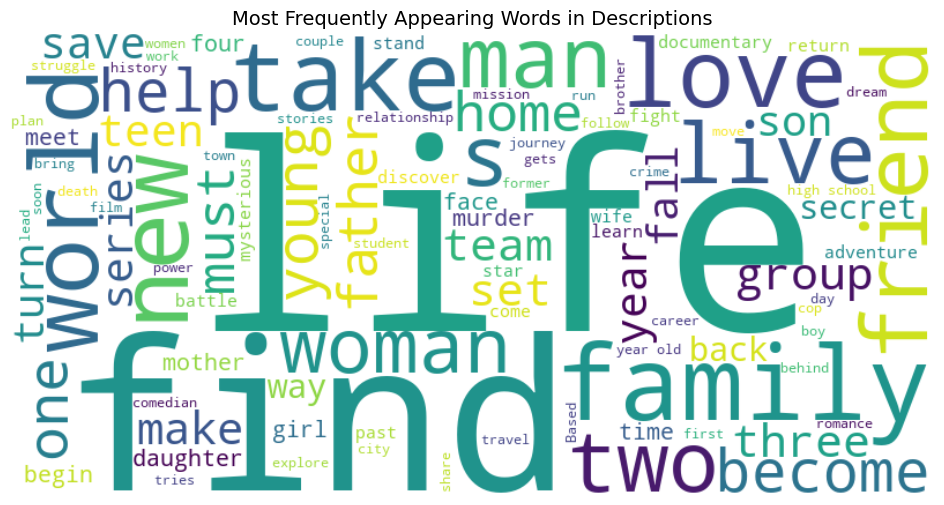
Most Frequently Appearing Words in Descriptions