Spotify Listening Trends Analysis
Home // AI-Powered Data Analysis
📋 Introduction
In today’s digital music era, analyzing listening patterns is essential for both users and streaming platforms. This analysis delves into Spotify Albums Data, offering valuable insights into user engagement, album popularity, and listening trends over time.
🔎 Project Overview
🎯 Objective:
- Analyze Spotify listening data to uncover user engagement and music trends.
🎨 Workflow
Data Cleaning / Quality Check – Ensure data accuracy, remove duplicates, and handle missing values using Power Query.- Data Modeling – Structure relationships between tables for efficient data analysis.
- Data Processing – Transform and refine data for optimized performance in Power BI.
- DAX Calculations – Create calculated columns, measures, and KPIs for deeper insights.
- Dashboard Layouting – Design an intuitive and user-friendly Power BI dashboard.
- Charts Development & Formatting – Visualize data effectively using customized charts and graphs.
- Dashboard / Report Development – Build an interactive and insightful report.
- Insights Generation – Extract key findings to understand listening trends, user behavior, and music preferences.
🛠 Tools Used:
- Power Query – Data cleaning and quality checks.
- Power BI – Data visualization and analysis.
- PowerPoint – Dashboard Layouting
📌 Key Focus Areas:
- Track album, artist, and song popularity over time.
- Identify listening habits (weekdays vs. weekends, peak hours).
- Compare year-over-year music consumption trends.
- Analyze platform usage (mobile, desktop, smart speaker).
📊 Final Deliverable:
- An interactive Power BI dashboard providing actionable insights for music listeners and industry professionals.
📊 Summary of the Dataset
🎵 Key Dataset Attributes
- Total Records: 149,860 listening history entries.
- Total Columns: 11 key features related to track metadata, playback behavior, and user interaction.
- Data Coverage: Includes details on song playback time, platform usage, shuffle mode, and user behavior (e.g., skips, autoplay).
👤 User & Playback Details
- User Behavior: Captures how users interact with music (shuffle, skipping, autoplay).
- Listening Platform: Identifies the device used (e.g., desktop, mobile, web, smart speaker).
- Timestamp: Tracks when a song was played (UTC format).
- Session Analysis: Can be used to understand listening habits and music trends.
🎼 Track & Artist Information
- Track Name: The title of the song being played.
- Artist Name: The performer or band of the song.
- Album Name: The album in which the song appears.
- Spotify Track URI: A unique identifier for cross-referencing Spotify’s catalog.
📊 Playback & Interaction Details
-
Playback Duration (
ms_played):- Time (in milliseconds) a song was played before being stopped or skipped.
- Helps in engagement analysis and revenue calculations.
-
Start & End Reasons (
reason_start,reason_end):- Captures why a song started or stopped (e.g., autoplay, manual click, track completed, skip button).
- Useful for behavioral insights on user preferences.
-
Shuffle Mode (
shuffle):- Indicates whether the song was played in shuffle mode (True/False).
-
Skipped (
skipped):- Boolean indicator of whether the song was skipped before finishing.
🚀 Potential Analyses & Insights
- Top Artists & Songs: Identify most played artists, albums, and tracks.
- Listening Patterns: Analyze peak listening times and trends.
- User Engagement: Determine completion rates, skips, and shuffle usage.
- Platform Usage: Understand where users consume music most (mobile, desktop, smart speaker).
- Session Duration: Explore how long users listen in one session.
🔑 Business Requirements
🎵 Albums Analysis
- Total Albums Played Over Time – Track album listening trends across months and years.
- Number of Albums Listened by Year – Identify annual listening volume and habits.
- Albums Played on Weekdays & Weekends – Understand listening patterns based on day of the week.
- Top 5 Albums – Highlight the most played albums.
- Latest Year vs Previous Year Analysis – Compare album consumption trends, including:
- LY (Latest Year) vs PY (Previous Year) Trends
- YoY (Year-over-Year) Growth Analysis
🎤 Artists Analysis
- Total Artists Played Over Time – Track artist listening trends.
- Number of Artists Listened by Year – Assess annual diversity in artist engagement.
- Artists Played on Weekdays & Weekends – Identify user listening behavior by day.
- Top 5 Artists – Showcase the most played artists.
- Latest Year vs Previous Year Analysis – Compare artist popularity trends over time.
🎼 Tracks Analysis
- Total Tracks Played Over Time – Monitor track listening trends.
- Number of Tracks Listened by Year – Evaluate track diversity in listening habits.
- Tracks Played on Weekdays & Weekends – Identify peak listening days.
- Top 5 Tracks – Determine the most frequently played tracks.
- Latest Year vs Previous Year Analysis – Compare track consumption trends over years.
⏳ Listening Patterns
- Listening Hours Analysis – Use a heat map to identify peak listening hours.
- Average Listening Time vs Track Frequency – Apply quadrant analysis to classify tracks into:
- High Frequency & High Listening Time (Most engaging)
- Low Frequency & High Listening Time (Niche but impactful)
- High Frequency & Low Listening Time (Short, frequently played)
- Low Frequency & Low Listening Time (Less popular)
📊 Details Grid & Drill-Through
- Grid View with Essential Fields – Display key attributes like Album, Artist, and Track Name.
- Drill Through Functionality – Allow users to explore detailed insights from high-level reports.
- Drill Down, Drill Up, and Hierarchy – Enable structured navigation for in-depth data exploration.
⚙ Data Analysis & Visualization
Data Import
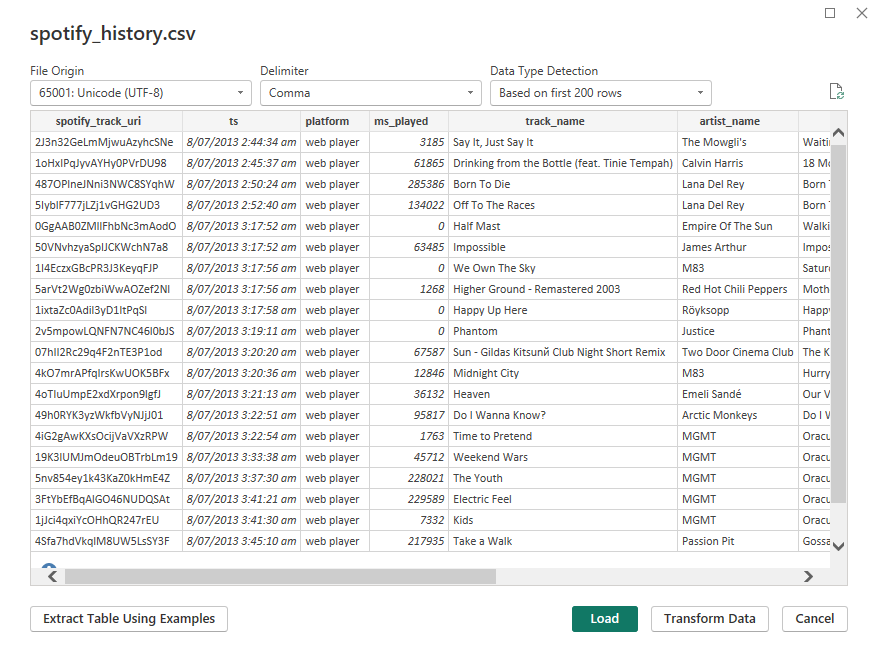
- Loading the dataset from a CSV file.
- Previewing the data structure (columns like track name, artist, platform, and play duration).
Data Quality Check
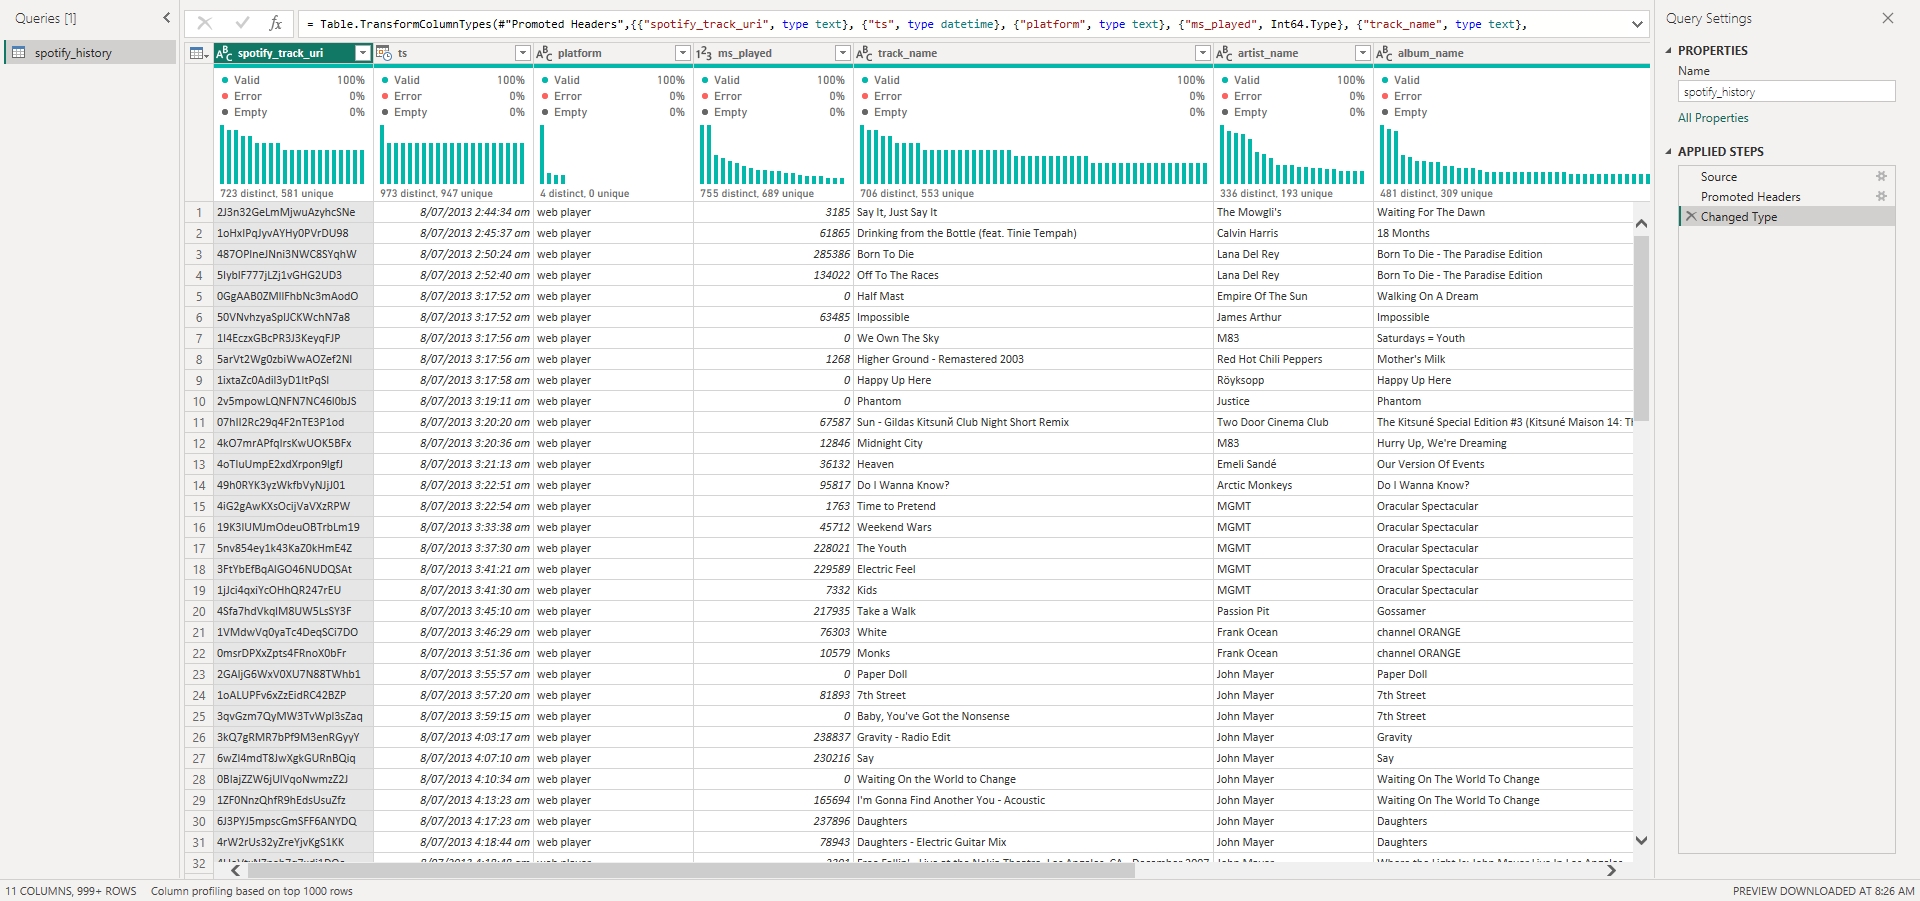
- Column Profiling – Analyzing data validity, uniqueness, and distribution.
- Data Type Adjustment – Converting columns like
ts(timestamp) to datetime format. - Handling Errors & Missing Values – Ensuring data consistency.
Data Modeling
- Create Date Table
					Data Table = CALENDAR(MIN(spotify_history[ts]),MAX(spotify_history[ts]))
Data Table = CALENDAR(MIN(spotify_history[Track Played Date]),MAX(spotify_history[Track Played Date]))
- Create Columns
					Track Played Date = DATE(YEAR(spotify_history[ts]),MONTH(spotify_history[ts]),DAY(spotify_history[ts]))
Track Played Time = FORMAT(spotify_history[ts],"HH:MM:SS")
Year = YEAR('Data Table'[Date])
Day Name = FORMAT('Date Table'[Date],"DDD")
Weeday_Weekend = IF(WEEKDAY('Date Table'[Date],2)<=5,"Weekday","Weekend")
Hour = HOUR(spotify_history[Track Played Time] )
- Data Modeling
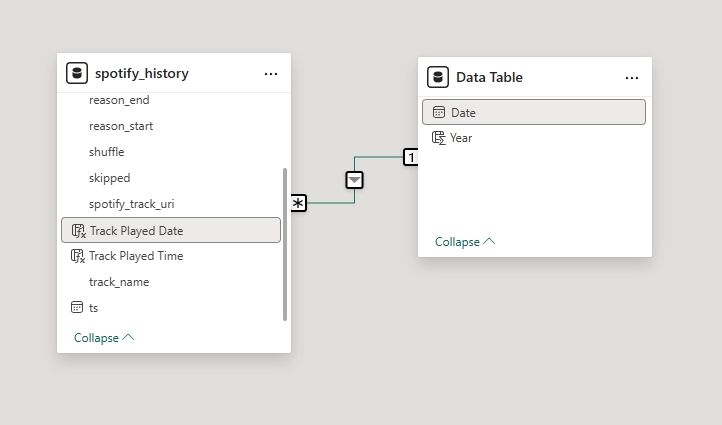
- Primary Table:
spotify_history– Contains track details and playback data. - Date Table:
Data Table– Used for time-based filtering and analysis. - Relationship:
Track Played Date(inspotify_history) is linked toDate(inData Table).- One-to-Many relationship – A single date connects to multiple track records.
DAX Calculations
- Highlight the minimum and maximum album / artist / track counts
					MinMax Albums Line Chart =
VAR _MaxValue = MAXX(ALLSELECTED('Data Table'[Year]),CALCULATE(DISTINCTCOUNT(spotify_history[album_name])))
VAR _MinValue = MINX(ALLSELECTED('Data Table'[Year]),CALCULATE(DISTINCTCOUNT(spotify_history[album_name])))
VAR _CurrentValue = DISTINCTCOUNT(spotify_history[album_name])
RETURN
    IF(_CurrentValue = _MaxValue || _Currentvalue = _MinValue, _CurrentValue, BLANK())

MinMax Artist Line Chart =
VAR _MaxValue = MAXX(ALLSELECTED('Date Table'[Year]),CALCULATE(DISTINCTCOUNT(spotify_history[artist_name])))
VAR _MinValue = MINX(ALLSELECTED('Date Table'[Year]),CALCULATE(DISTINCTCOUNT(spotify_history[artist_name])))
VAR _CurrentValue = DISTINCTCOUNT(spotify_history[artist_name])
RETURN
    IF(_CurrentValue = _MaxValue || _Currentvalue = _MinValue, _CurrentValue, BLANK())
- Calculates the distinct number of albums / artists / tracks played in the latest year
					LatestYearAlbums =
VAR _LatestYear = MAX('Data Table'[Year])
RETURN
    CALCULATE(DISTINCTCOUNT(spotify_history[album_name]),'Data Table'[Year] = _LatestYear)

LatestYearArtist =
VAR _LatestYear = MAX('Date Table'[Year])
RETURN
    CALCULATE(DISTINCTCOUNT(spotify_history[artist_name]),'Date Table'[Year] = _LatestYear)

LatestYearTrack =
VAR _LatestYear = MAX('Date Table'[Year])
RETURN
    CALCULATE(DISTINCTCOUNT(spotify_history[track_name]),'Date Table'[Year] = _LatestYear)
- Calculates the distinct number of albums / artists / tracks played in the previous year
					PreviousYearAlbums =
VAR _LatestYear = MAX('Data Table'[Year])
VAR _PreviousYear = _LatestYear-1
RETURN
    CALCULATE(DISTINCTCOUNT(spotify_history[album_name]),'Data Table'[Year] = _PreviousYear)

PreviousYearArtists =
VAR _LatestYear = MAX('Date Table'[Year])
VAR _PreviousYear = _LatestYear-1
RETURN
    CALCULATE(DISTINCTCOUNT(spotify_history[artist_name]),'Date Table'[Year] = _PreviousYear)

PreviousYearTracks =
VAR _LatestYear = MAX('Date Table'[Year])
VAR _PreviousYear = _LatestYear-1
RETURN
    CALCULATE(DISTINCTCOUNT(spotify_history[track_name]),'Date Table'[Year] = _PreviousYear)
- Calculates the Previous Year album count and the Year-over-Year growth percentage
					PY and YoY Albums KPI =
 VAR _latest = [LatestYearAlbums]
 VAR _previous = [PreviousYearAlbums]
 VAR _YoY = IF(NOT(ISBLANK(_previous)), DIVIDE(_latest-_previous,_previous,0),
                BLANK())
RETURN
    IF(NOT(ISBLANK(_previous)),
        "vs. PY: " & FORMAT(_previous,"#,##0") & "(" & FORMAT(_YoY,"0.00%") & ")","No Data")
- Change the percentage color dynamically based on its value
					PY YoY Color (CF)=
VAR _YoY = IF(NOT(ISBLANK([PreviousYearAlbums])),
              DIVIDE([LatestYearAlbums] - [PreviousYearAlbums], [PreviousYearAlbums], 0),
              BLANK())

RETURN
    IF(_YoY < 0, "Red", "Green")
- Finds the most recent year in the dataset
Max Year = MAX('Date Table'[Year])
- Calculates the week number for each date
Day Number = WEEKNUM('Date Table'[Date])
- Measure returns the day number of the week
Day Number in Week = WEEKDAY('Date Table'[Date],2)
- Measure calculates the average listening time in minutes by converting milliseconds (ms) to minutes
Avg. Listening Time (min) = AVERAGE(spotify_history[ms_played])/60000
- Measure calculates the total number of track plays
Track Frequency = COUNTROWS(spotify_history)
- Categorizes tracks into four quadrants based on their average listening time and track frequency
					CF Quadrant =
 VAR avgtime = [Avg. Listening Time (min)] <= 'Listening Time (min)'[Listening Time (min) Value]
 VAR trackfreq = [Track Frequency] >= 'Track Frequency (para)'[Track Frequency (para) Value]
 VAR RESULT =
    SWITCH(TRUE(),
            avgtime && trackfreq,1,  --LowTime & High Freq
            NOT avgtime && trackfreq,2,  --High Time & High Freq
            NOT avgtime && NOT trackfreq,3, -- High Time & Low Freq
            avgtime && NOT trackfreq,4 ) --Low Time & Low Freq
RETURN RESULT